Energy Monitoring
Sowel includes built-in energy monitoring that tracks your home's electricity consumption and (optionally) your solar production over time. It supports peak / off-peak tariff classification, autoconsumption tracking, and a by-usage breakdown when you instrument dedicated circuits.
The three energy equipment types
Energy monitoring in Sowel is integration-agnostic. Any plugin that reports energy or power data on a device can feed the energy pipeline, as long as the device is bound to one of these three equipment types.
| Equipment type | What it represents | Required device data |
|---|---|---|
main_energy_meter |
Your main grid meter (whole-home import / export) | Cumulative energy (Wh), or a signed grid energy delta per tick |
energy_meter |
A submeter on a dedicated circuit (heat pump, pool, EV charger, ...) | Cumulative energy (Wh) or instantaneous power (W) |
energy_production_meter |
Your solar (or other local production) meter | Cumulative production energy (Wh) |
You can mix and match: a setup with only a main meter is fine, you do not need solar to use the Energy page. Conversely, you can have many submeters without a main meter — you will just lose the "Other" residual on the by-usage view.
Power-only submeters
Cheap zigbee clamps that report only power (W) and not energy (Wh) are supported for submeters. Sowel integrates the power signal locally into a Wh stream attributed to the submeter equipment, with the same per-minute cadence as the main meter. State survives restarts.
How the data flows
Energy meter device (any integration)
  -> Plugin reports `energy` (Wh) or `power` (W)
    -> HistoryWriter writes per-minute points to InfluxDB
      -> EnergyAggregator computes hour / day / month / year cumuls
        -> Energy page renders charts and totals
InfluxDB stores raw points in a short-retention bucket, then automatic downsampling tasks aggregate them into hourly and daily buckets with much longer retention. The Energy page picks the right bucket transparently based on the time range you are looking at.
InfluxDB is automatic
InfluxDB is mandatory and starts with Sowel via Docker Compose. On first launch, Sowel auto-creates the required buckets, downsampling tasks, and energy aggregation tasks. No manual InfluxDB configuration is needed.
Setting up energy monitoring
Step 1: Connect an energy integration
Install a plugin that provides energy meter devices (browse the catalogue from Administration > Plugins) and configure it from Administration > Integrations. Any plugin that surfaces a device exposing energy or power data is eligible.
Step 2: Create the main energy meter equipment
Go to Administration > Equipments and create an equipment:
- Type: Main Energy Meter
- Zone: typically the Home root, or a Utility zone
- Bind to your grid meter device's
energydata
Once bound, Sowel starts writing one energy point per minute to InfluxDB.
Step 3: (Optional) Add a production meter
If you have local production (solar panels typically), create an equipment of type Energy Production Meter and bind it to your production meter device. With both a main meter and a production meter in place, Sowel computes:
- Grid consumption: energy drawn from the grid
- Autoconsumption: energy produced and consumed in the house
- Grid injection: energy produced and pushed to the grid
- Total consumption: grid + autoconsumption
Step 4: (Optional) Configure peak / off-peak tariffs
If your electricity plan splits hours into peak and off-peak, configure the schedule so Sowel can break down your consumption.
Go to Settings > Administration > Energy tariffs:
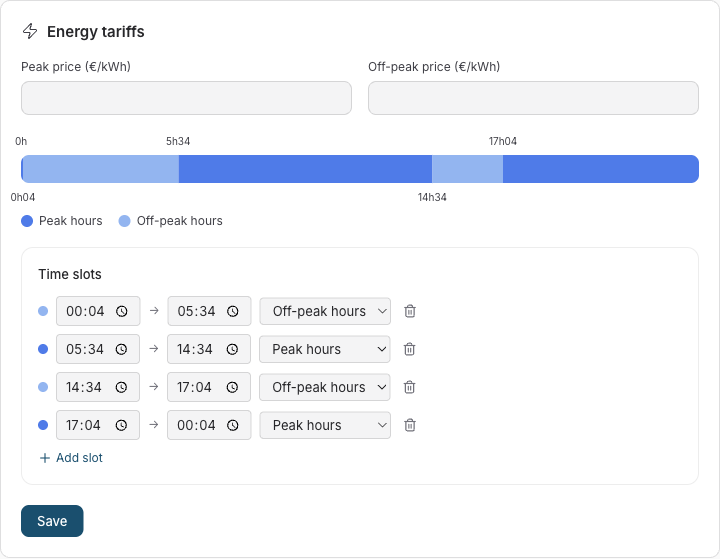
- Optionally enter your peak and off-peak prices per kWh (used for cost views; classification works without them)
- Define your time slots: which hours are peak and which are off-peak
- You can add as many slots as you need to cover the 24 hours of the day
If no tariff is configured, all consumption is classified as peak by default — you simply do not see the split.
Step 5: (Optional) Add submeters for a by-usage breakdown
To know how your main meter's consumption splits across circuits, add an energy_meter equipment for each circuit you instrument.
- Install a zigbee energy clamp, smart plug, or Wi-Fi meter on the dedicated circuit
- Go to Administration > Equipments and create an equipment of type Energy Meter
- Bind it to the device's
energy(Wh) data, or — if your device reports onlypower(W) — to itspowerdata: Sowel integrates the power signal into a Wh stream automatically
Once at least one submeter is configured, the By usage toggle appears on the Consumption page. The toggle is hidden when no submeter exists.
Using the Energy section
The sidebar groups the energy views under Energy:
- Live: instant flow between grid, production, and house consumption
- Consumption: historical consumption with peak / off-peak split and self-consumption overlay
- Production: historical solar production with autoconsumption / injection split
Live view
The Live view shows what is happening right now — power values updated in real time via WebSocket.
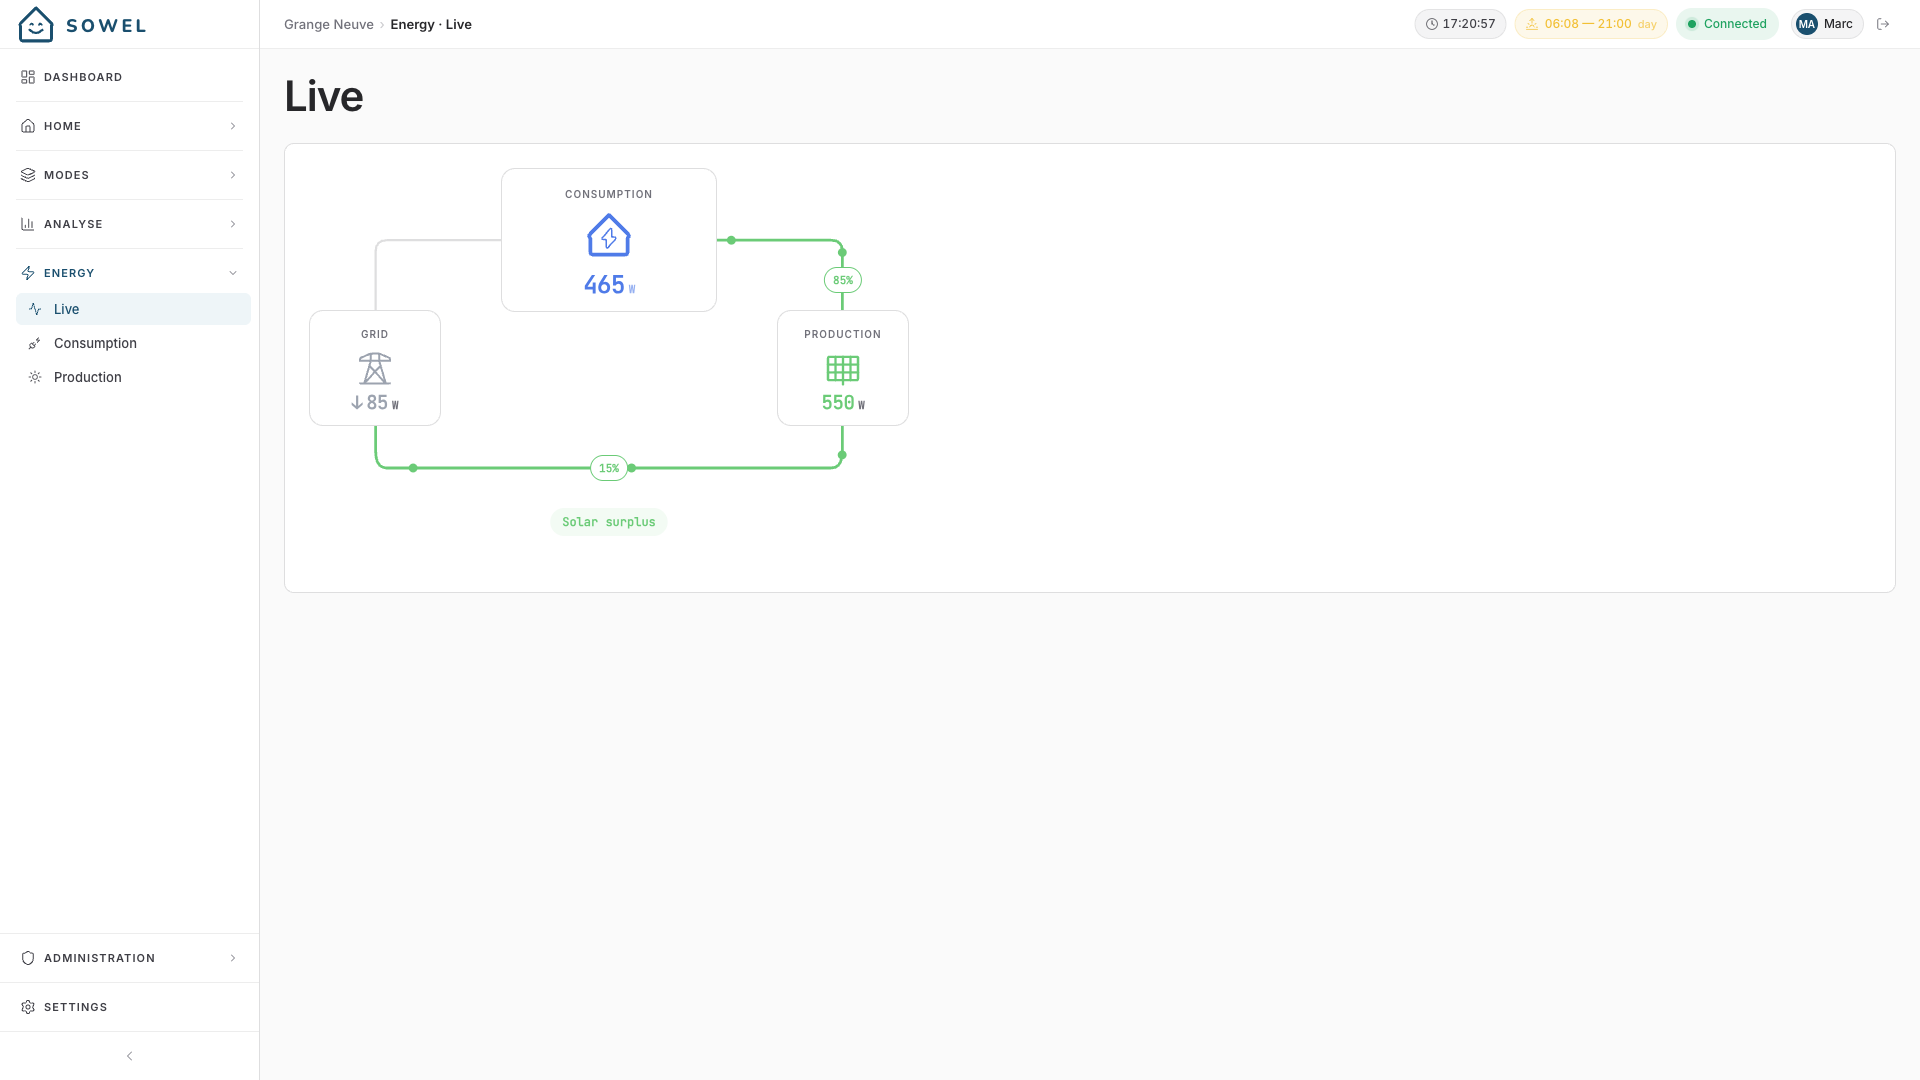
The diagram shows three boxes (Grid, Consumption, Production) with arrows indicating the direction of energy flow. When solar production exceeds in-house consumption, a "Solar surplus" indicator appears, and the share of solar going to the grid versus to the house is shown on the arrows.
Tiles are hidden when their underlying equipment is not configured: with no production meter, only Grid and Consumption are shown.
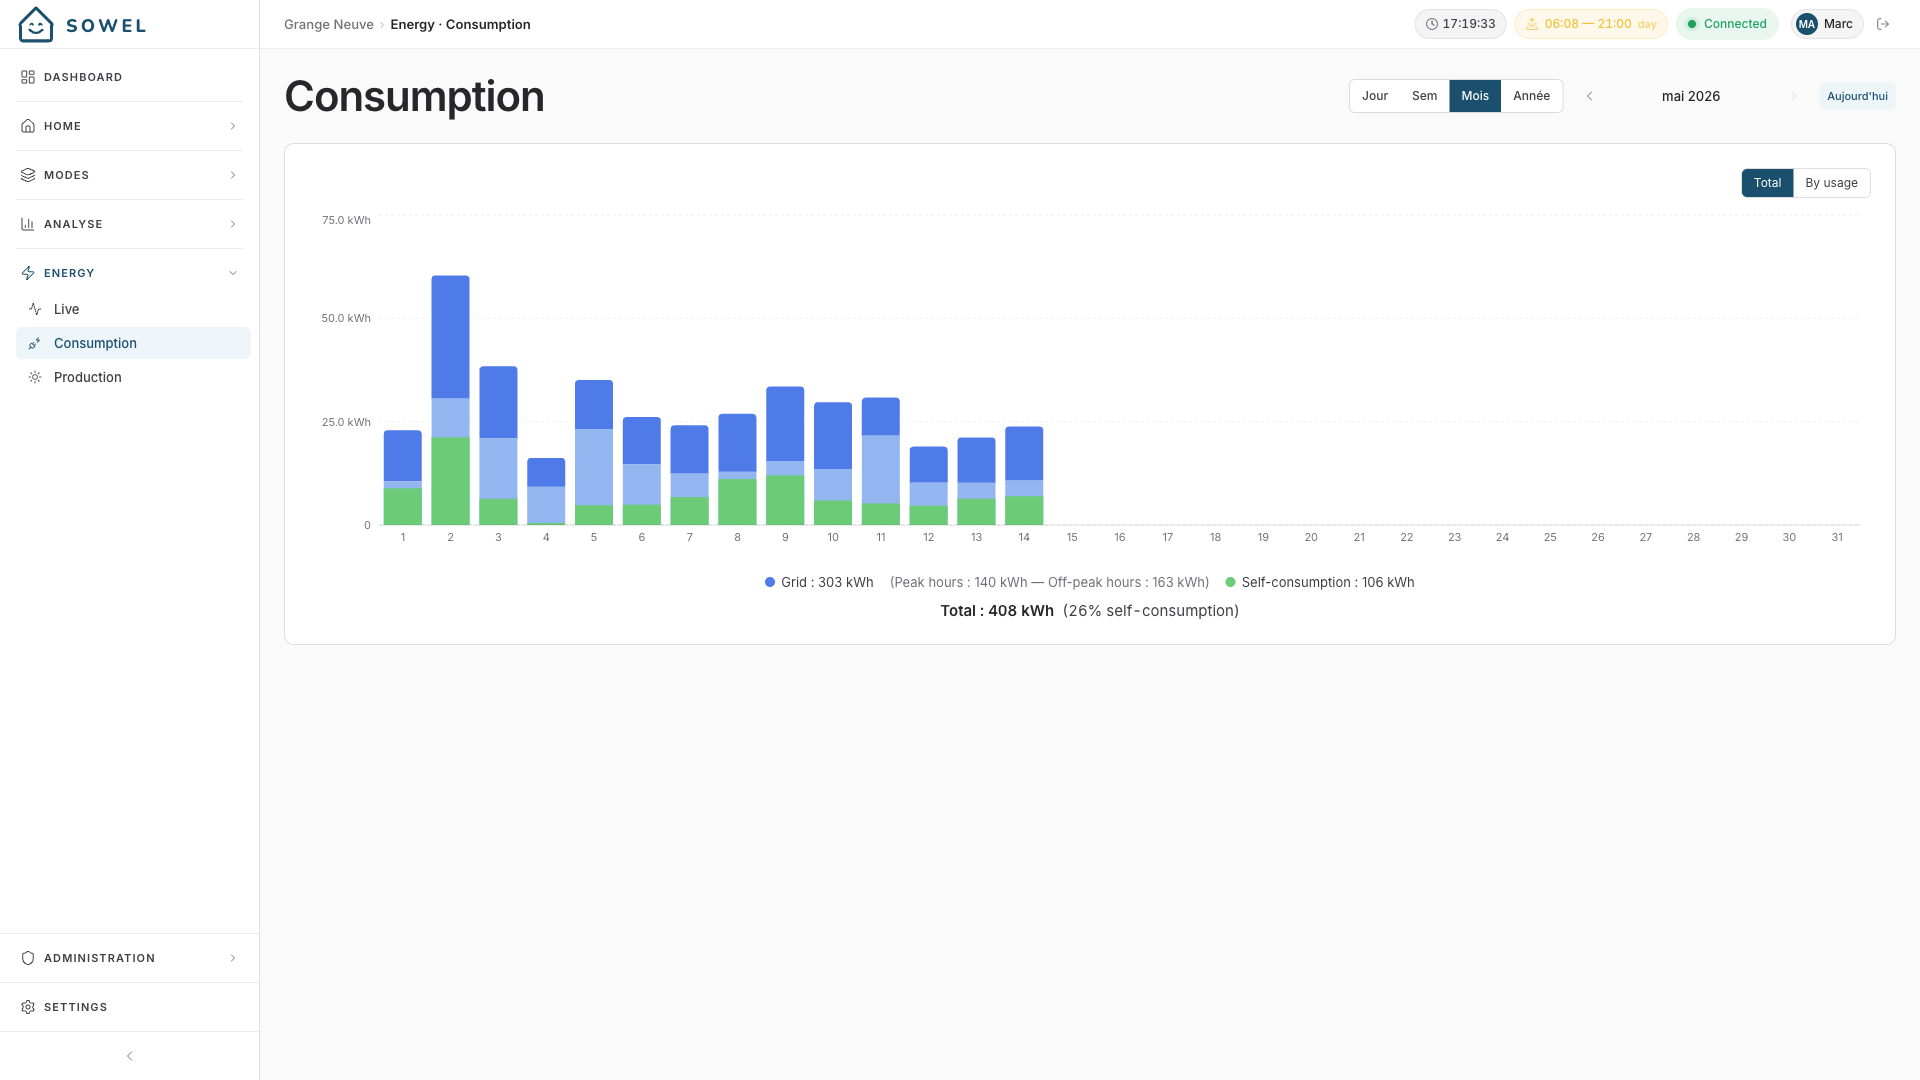
Consumption view
Pick a period (Day, Week, Month, Year) and navigate dates with the arrows. The chart renders bars for each time bucket of the selected period.
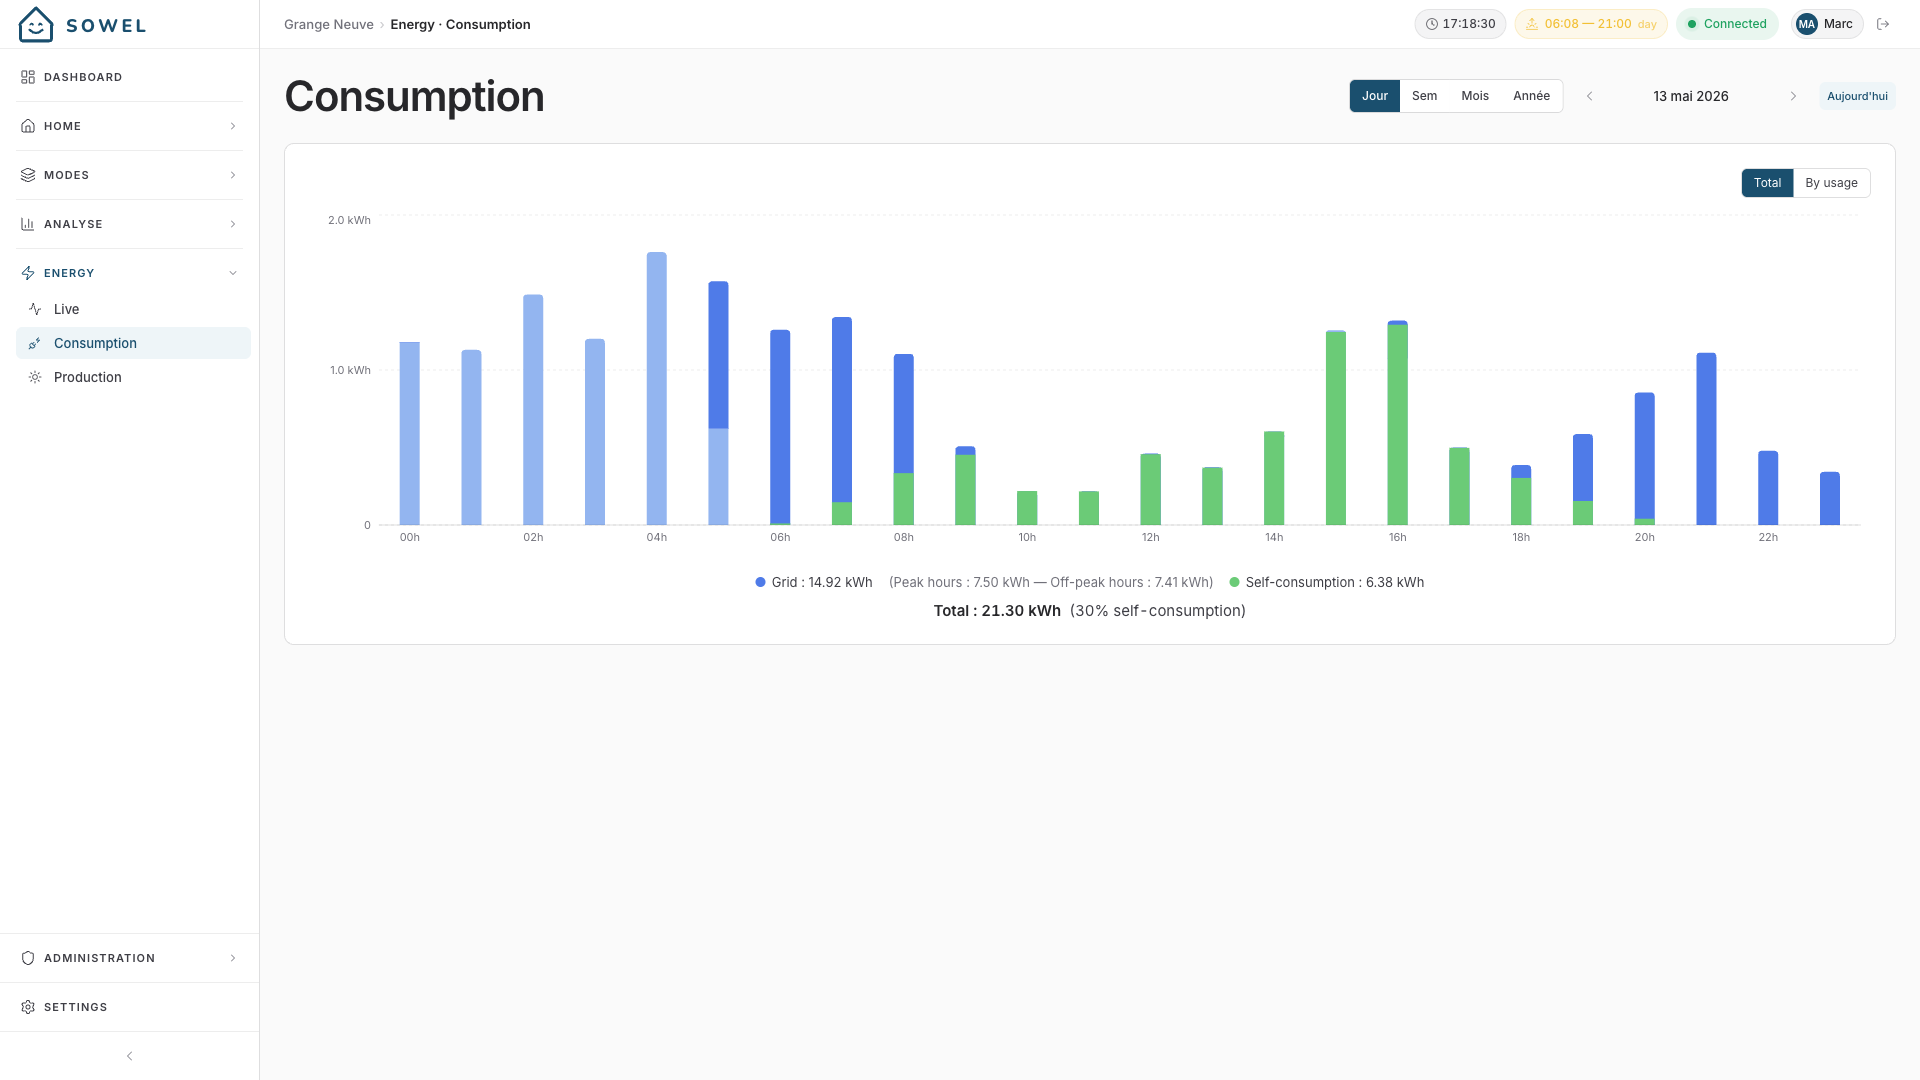
Color coding on the Total chart:
| Color | Meaning |
|---|---|
| Dark blue | Peak-hours grid consumption |
| Light blue | Off-peak-hours grid consumption |
| Green | Autoconsumption (only when a production meter is set up) |
Below the chart, totals are shown in kWh: grid (split into peak / off-peak), autoconsumption, and total (with the self-consumption share as a percentage).
Wh / € unit toggle
A Wh / € segmented toggle sits next to the period selector at the top of the page. In € mode, every kWh figure on the bar chart (Y axis, bar height, tooltip) and on the totals card is replaced by the corresponding cost in euros, computed from the prices you entered in Settings > Energy tariffs. The toggle is disabled — with a tooltip pointing back to the tariff settings — until you set at least one of the HP / HC prices to a non-zero value.
Pricing is applied at read time, so changing your tariff (after a contract renegotiation, for example) re-values past consumption with the new prices. Autoconsumption has no billed cost and is therefore hidden from the chart in € mode.
Total / By usage toggle
When at least one submeter is configured, a Total / By usage toggle appears above the chart. The By usage view replaces the peak / off-peak split with one stack per submeter, plus an Other stack for the residual that the main meter saw but no submeter accounted for.
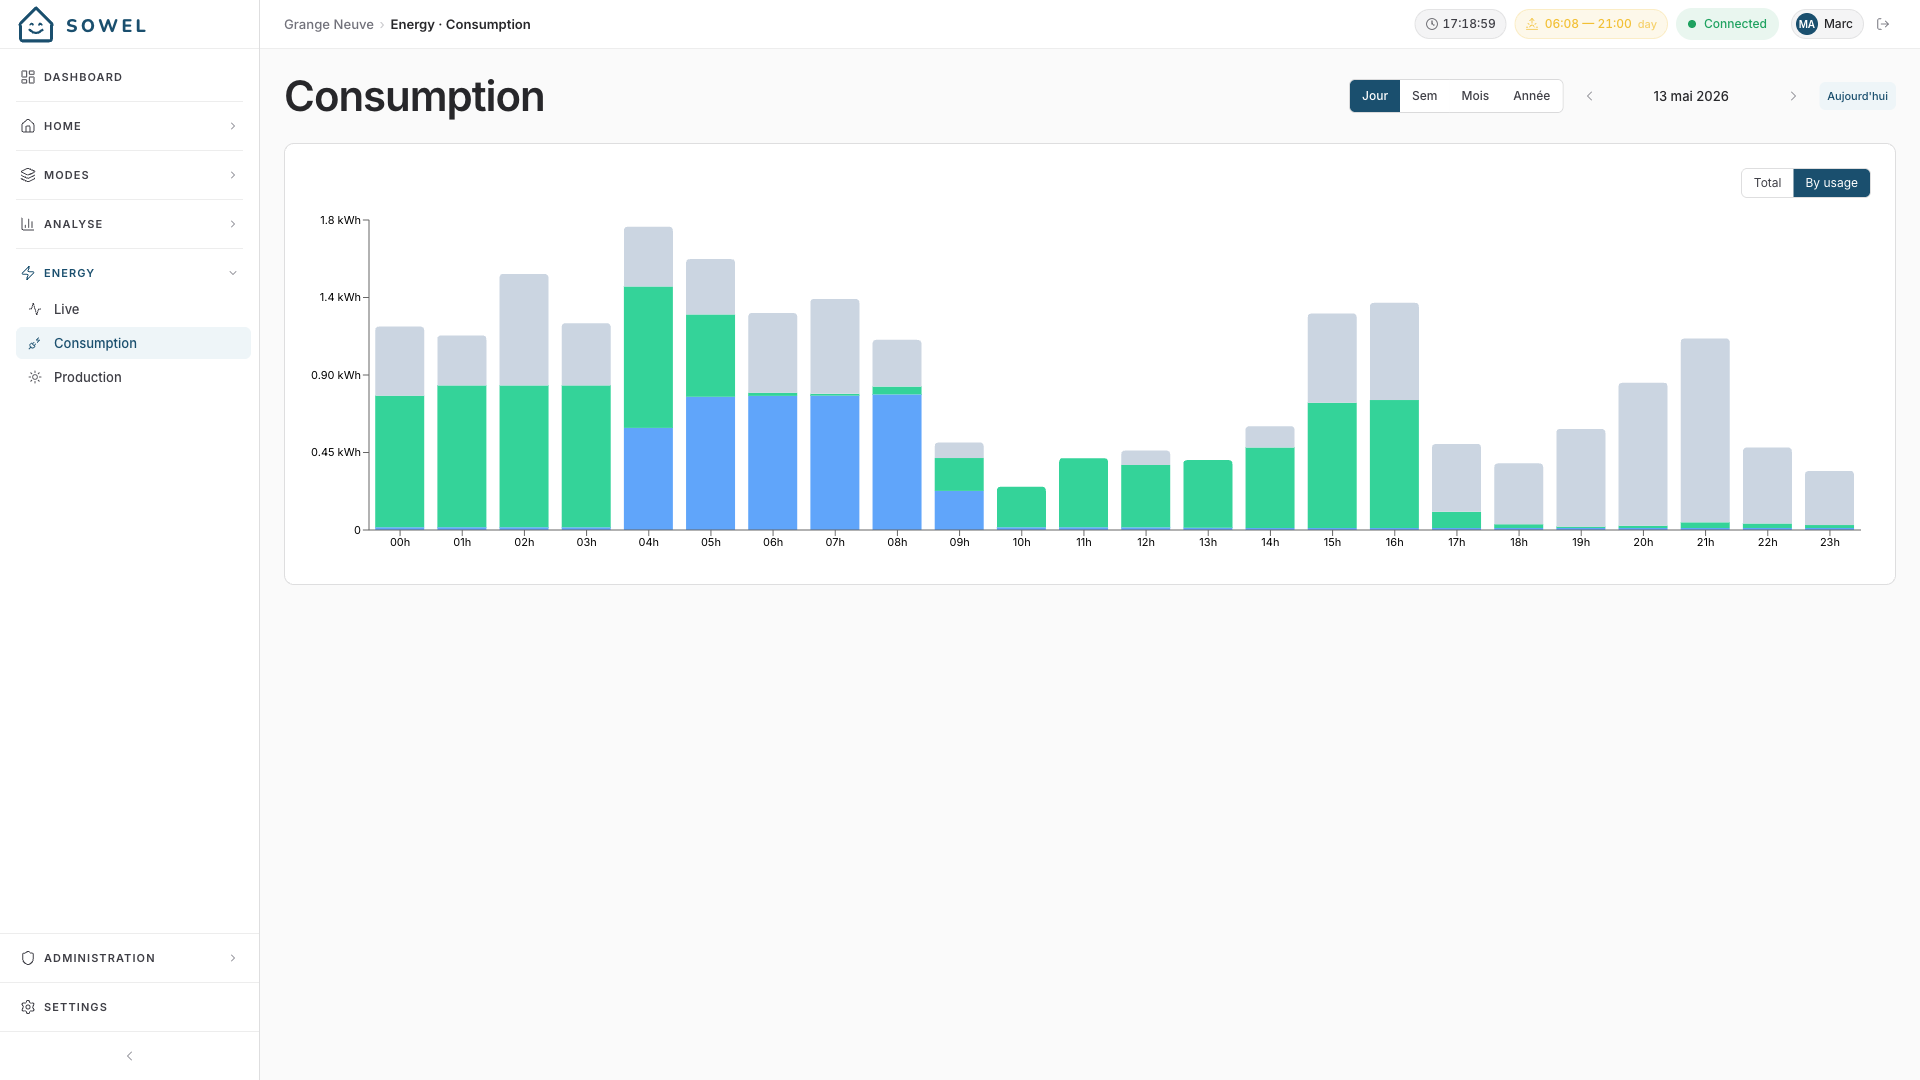
Submeters use a deterministic color palette so the same circuit keeps the same color across days and views. The "Other" stack is clamped at zero, so a submeter that briefly overshoots the main meter (due to sampling skew) cannot make it negative.
Totals widgets (peak / off-peak, autoconsumption) stay unchanged when you toggle modes.
Longer periods
Switching to Month or Year keeps the same colors and totals, but each bar represents a day (Month view) or a month (Year view).
Production view
The Production page renders solar (or other local production) history:
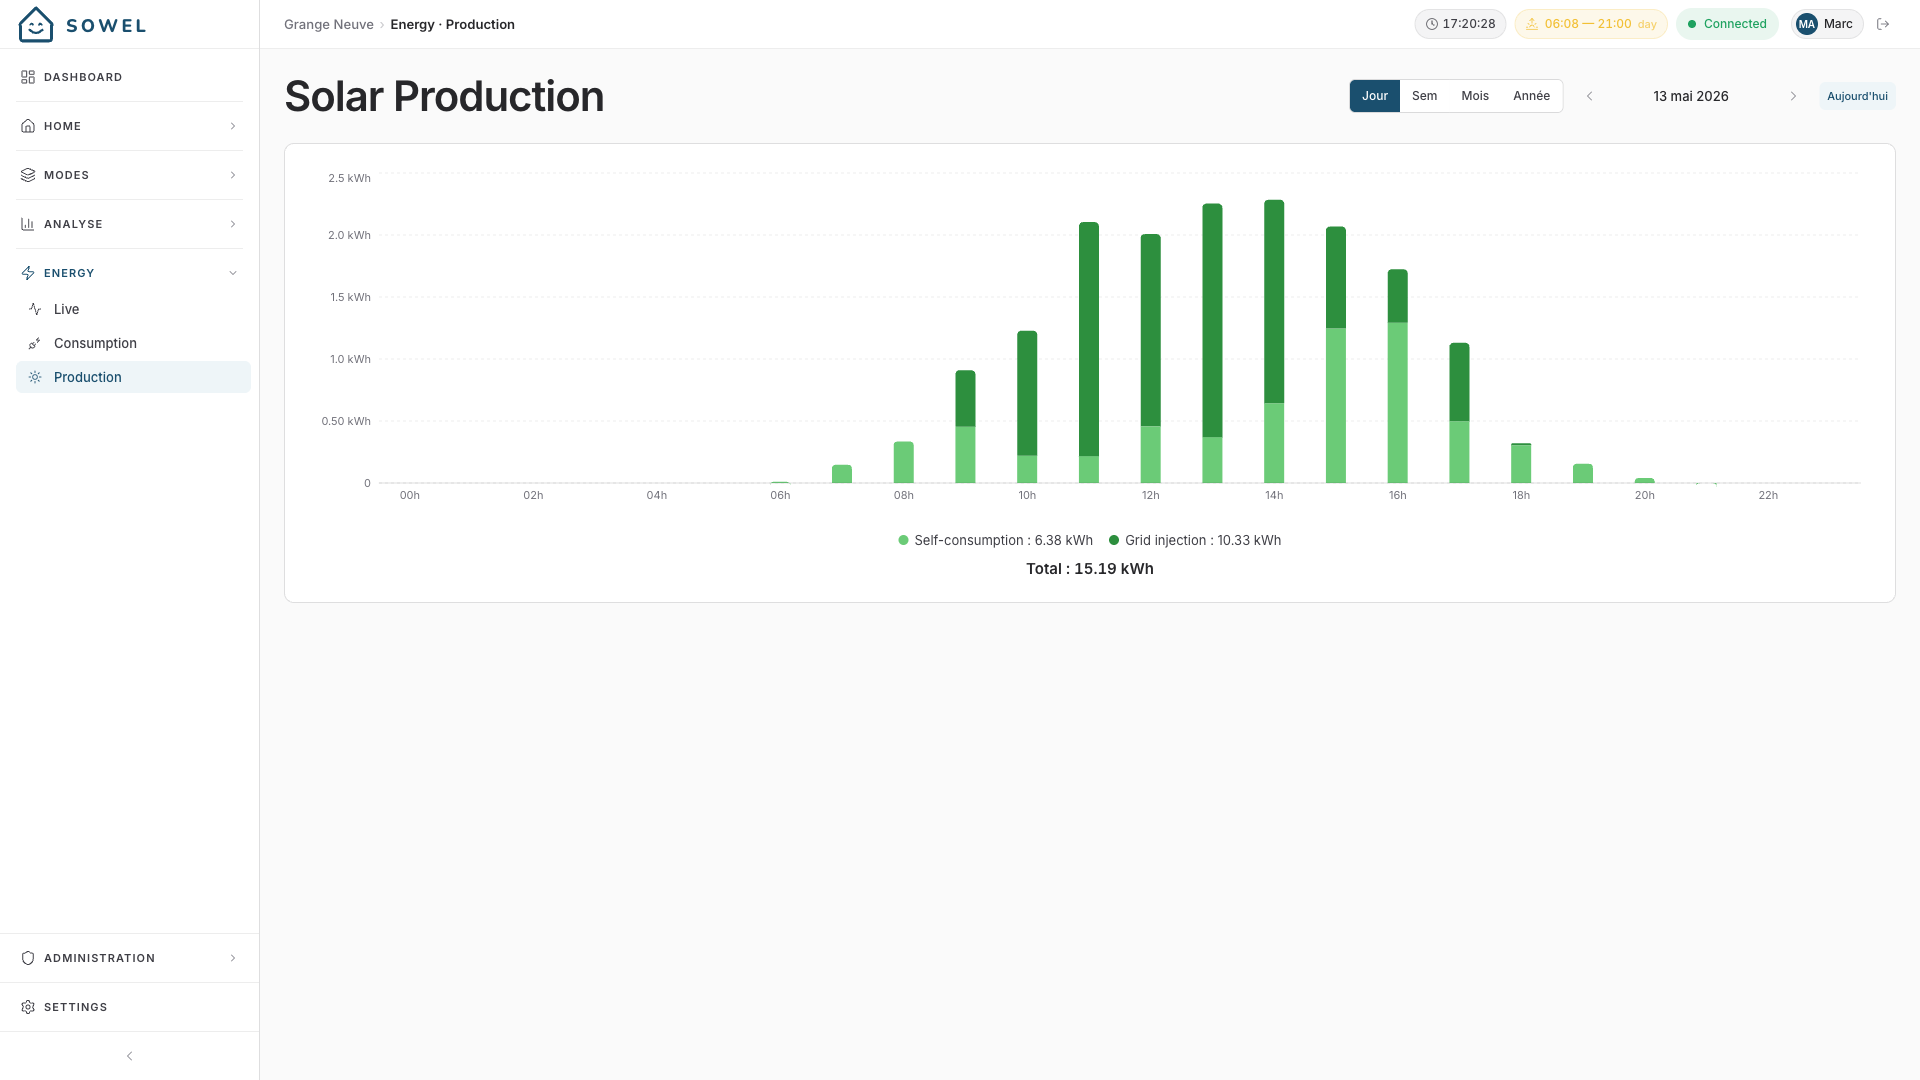
| Color | Meaning |
|---|---|
| Light green | Autoconsumption — produced and consumed locally |
| Dark green | Grid injection — produced and pushed back to the grid |
Totals below the chart sum the two slices into the day's, month's, or year's total production.
Data pipeline
Understanding how data flows helps with troubleshooting:
Plugin reports energy or power
  -> per-minute energy points written to InfluxDB "sowel" bucket  (7-day retention)
    -> sowel-energy-sum-hourly task
      -> "sowel-energy-hourly" bucket  (2-year retention)
        -> sowel-energy-sum-daily task
          -> "sowel-energy-daily" bucket  (10-year retention)
The Energy page chooses the bucket based on the period:
- Day view for today and recent days: queries the raw bucket for real-time accuracy
- Day view for older days: queries the hourly bucket
- Month / Year: queries the daily bucket for fast, long-range queries
The aggregator also keeps in-memory cumuls (hour, day, month, year) that the Live view and Home page widgets read directly, refreshed on every new energy tick.
Troubleshooting
No data appears on the Energy page
- Check that the integration providing your energy meter device is connected (green indicator in Administration > Integrations)
- Verify the equipment exists (Main Energy Meter and/or Energy Production Meter) and is bound to a device that actually emits
energydata - Wait for at least one polling / push cycle — exact frequency depends on the plugin, but typically a few minutes at most
- Check Settings > System > Logs for messages from the
history-writerorenergy-aggregatormodules
Peak / off-peak shows everything as peak
This means no tariff schedule is configured. Go to Settings > Administration > Energy tariffs and define your slots.
Old data is missing
Data older than 7 days lives only in the downsampled hourly and daily buckets. If those buckets are empty, the downsampling tasks have not run yet (they run once per hour and once per day). Check that InfluxDB is running and reachable, and inspect the logs of the history-writer module on startup — Sowel logs whether the tasks were created or already existed.
By usage view shows a large "Other" residual
This means your submeters do not cover most of the main meter's consumption — which is normal: the main meter sees everything in the house, while submeters typically cover specific high-power circuits. The residual is "Other circuits".
If the residual is negative (clamped to zero in the chart), one of your submeters is reporting more than the main meter sees — usually a clamp wired backwards or a calibration mismatch. The integrator clamps negative power deltas at zero and logs a WARN once per occurrence.